
 1 month ago
33
1 month ago
33

Key Takeaways
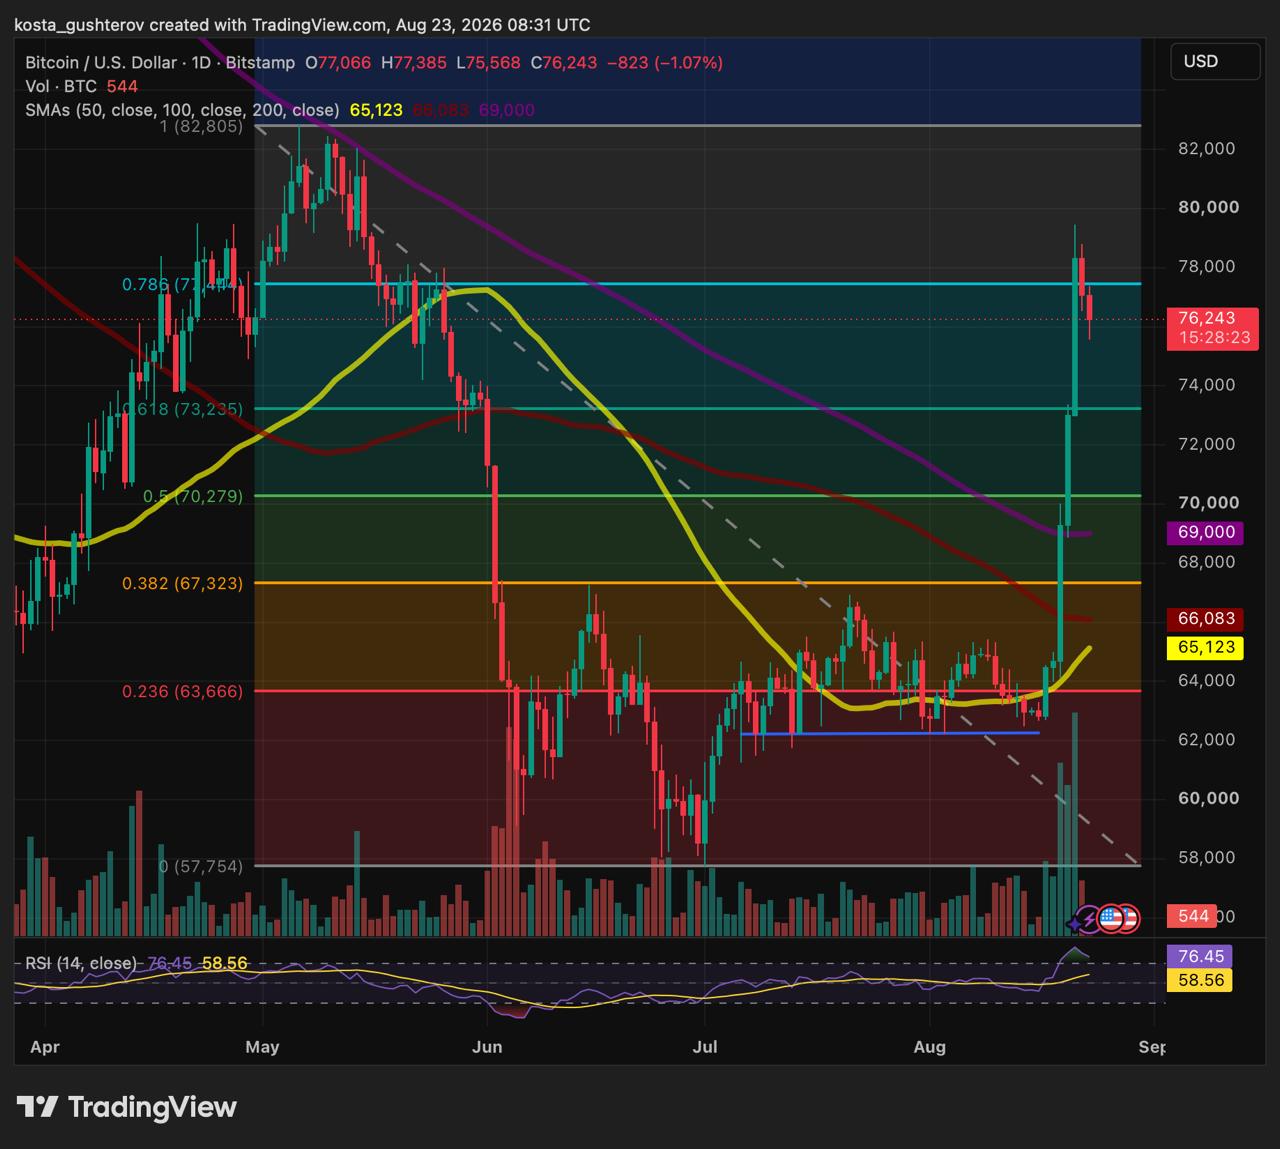
- $78K stopped the initial surge.
- $73,230 is the line in the sand.
- $69K–$70.3K anchors the wider recovery.
- A close above $77.4K reopens $82.8K.
- The chart dictates reality.
The breakout finally met its match
Bitcoin didn’t grind its way up; it tore through the $63,600, $67,300, and $70,280 Fibonacci levels in a matter of days, shattering a descending trendline that had capped the chart since May.
That momentum carried BTC directly into the $77,40 Fibonacci resistance zone, where the advance finally stalled. The August 23 daily chart shows Bitcoin trading near $76,200 after tagging $77,400 during the session, with an intraday low dipping to $75,500.
 Read Entire Article





 English (US)