
 28 minutes ago
1

Key Takeaways
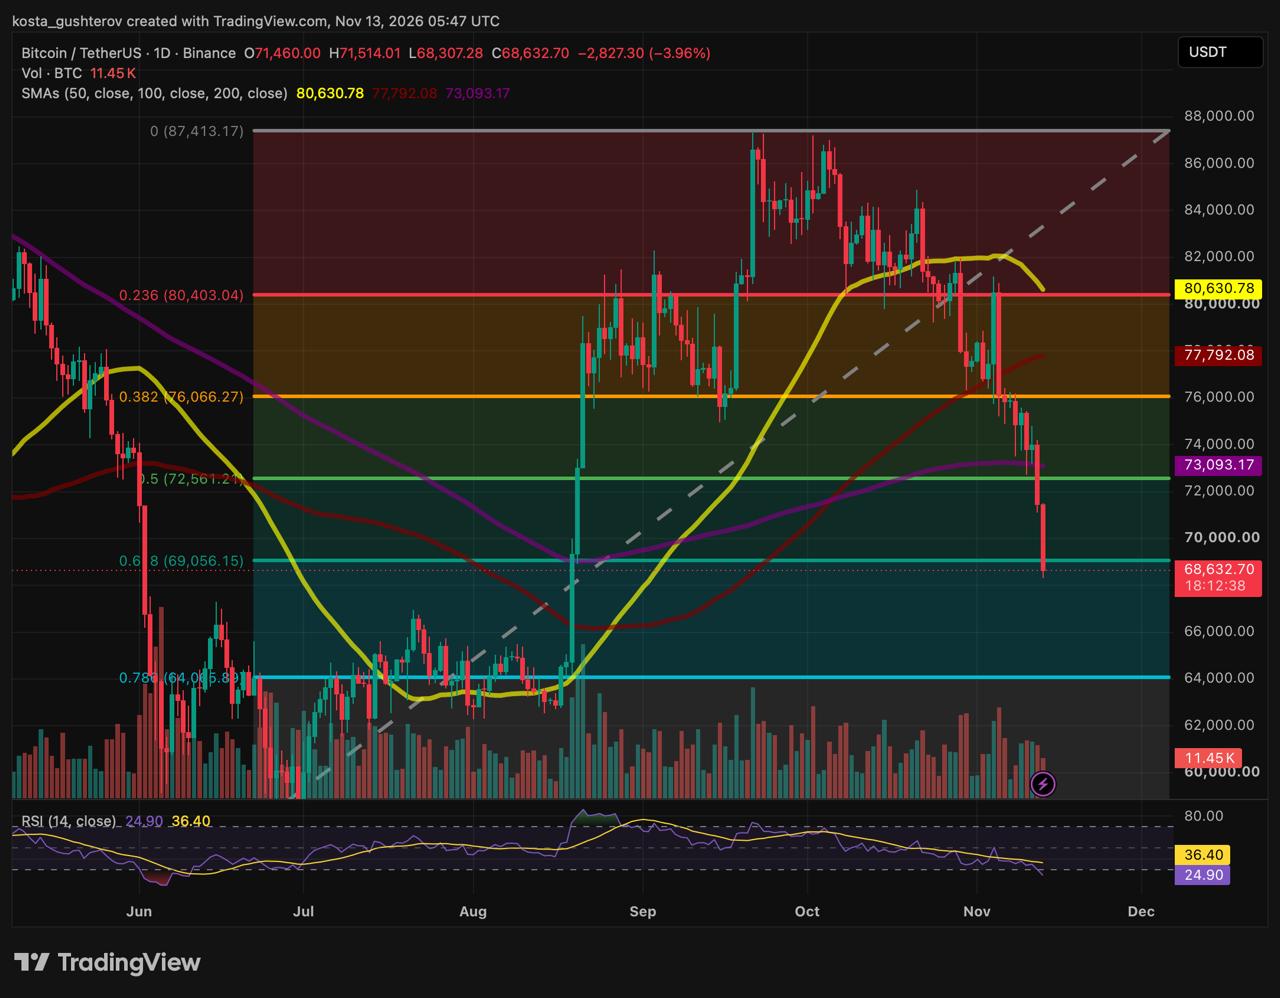
- BTC $68,633, down 3.96%, low $68,307.
- 0.618 near $69,056 broken; 0.786 near $64,036.
- 200-day SMA $73,093, 50-day $80,631 overhead.
- Daily RSI 24.90, lowest since June.
Coindoo’s Tuesday analysis marked a daily close under the 0.500 Fibonacci around $72,561 as the point where the 200-day would be surrendered; Thursday closed at $71,460. The readings below are from the Binance daily chart at 05:47 UTC on Friday, with just over 18 hours left in the session.
 Read Entire Article




 English (US)