

Bitcoin is trading around $64,925 on the daily chart, barely moved on the session at +0.05%. That flat close hides how tight the setup has become. Price is pressed up against the upper half of a two month range, and the levels above and below are close enough that the next daily candle could set the direction for weeks.
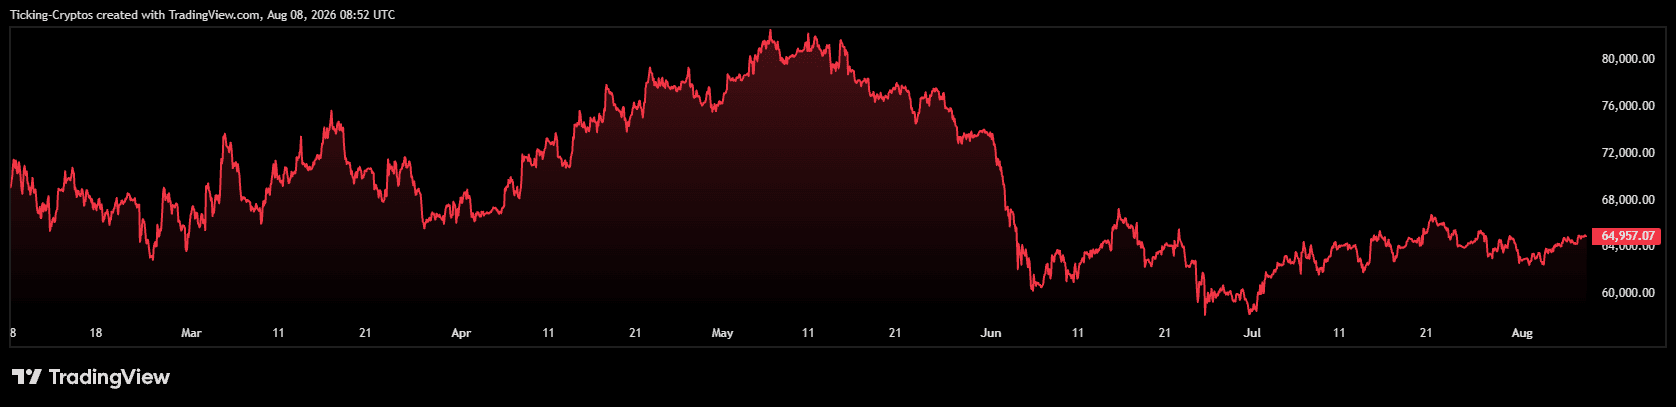 Bitcoin price USD
The chart has been range bound since the June breakdown. Bitcoin lost the low $70,000s in early June, dropped hard toward the high $50,000s in July, and has been grinding back up ever since. Now it is back at the top of that range with the same question in front of it: does resistance break, or does the range hold again?
Why Is $67,000 The Level Bitcoin Has To Break?
The $67,073 area is the single most important line on the daily chart right now.
- It capped the bounce in mid June after the crash.
- It capped the rally again in early August, where Bitcoin pushed toward it and got rejected.
- It sits directly above the current price, which me...





 English (US)