
 1 month ago
6
1 month ago
6

Key Takeaways
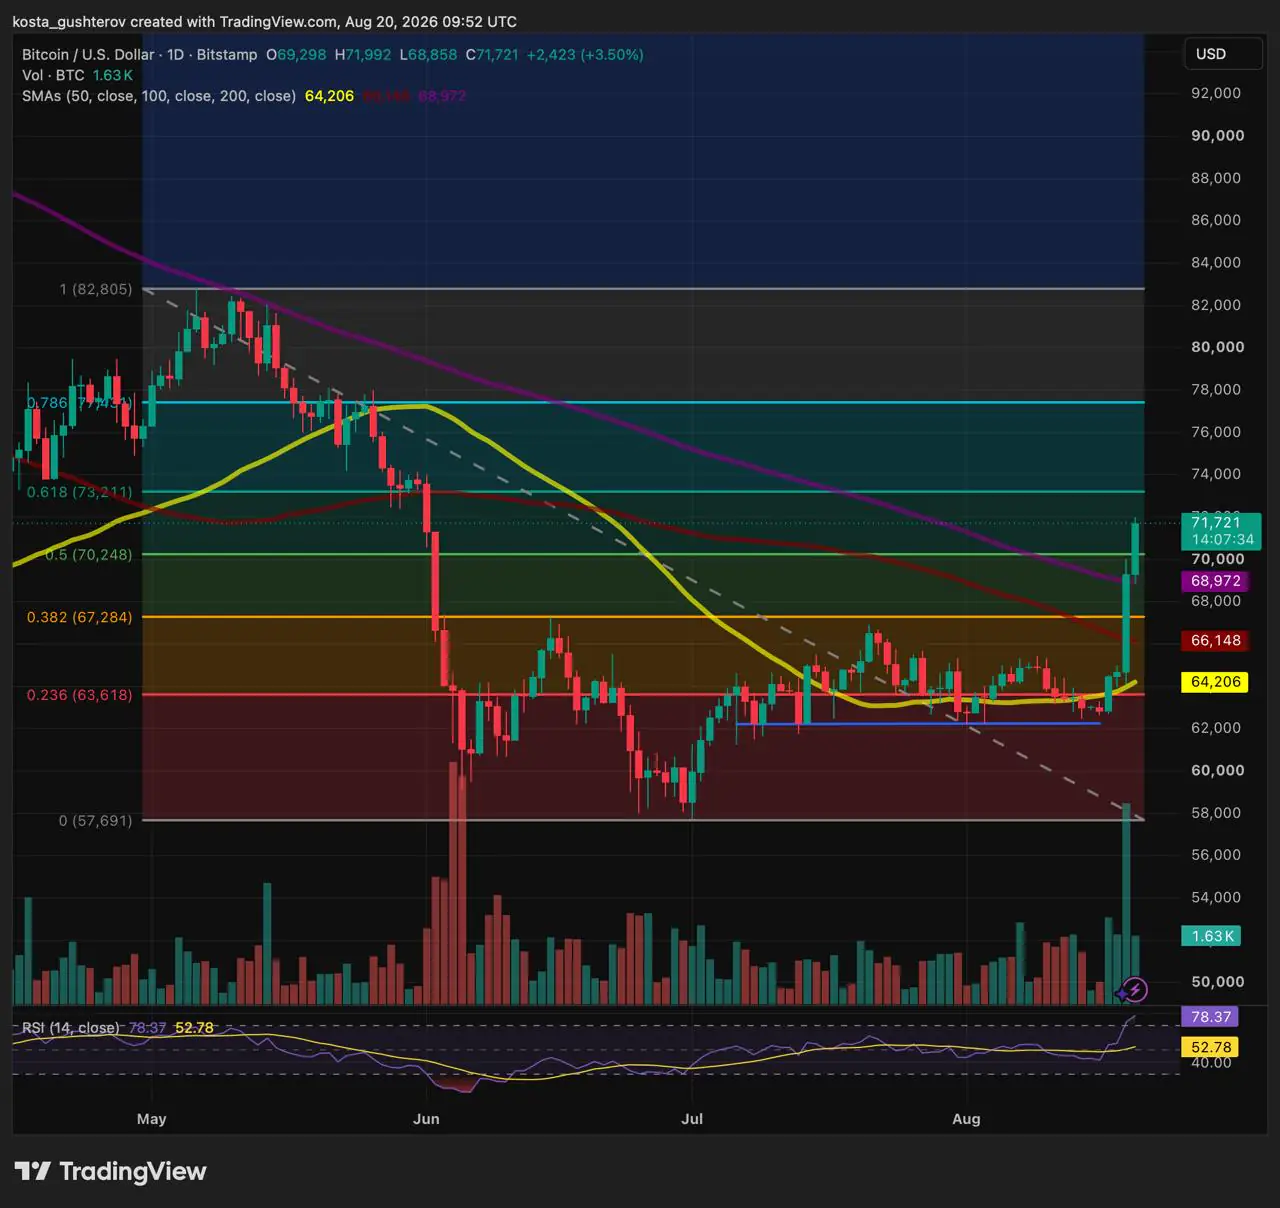
- $70,250 is the first level below price.
- The 200-day SMA sits at $68,970.
- $73,200 is the nearest resistance level.
- Liquidated shorts amplified the day’s price rise.
- Bitcoin ETFs recorded $517.19 million in inflows.
$70,250 is now the level Bitcoin needs to keep
The chart measures Bitcoin’s recovery from the June low near $57,700 toward the May high of $82,800. Fibonacci retracements divide that decline into proportions that traders watch when judging whether a rebound is developing into a broader recovery.
Bitcoin has reclaimed the halfway point at $70,250. That matters more than the round $70,000 mark because it is the level that separates the lower and upper halves of the May-to-June decline. Holding it on a retest would show that buyers are prepared to support the move after the initial breakout.





 English (US)