
 1 month ago
13
1 month ago
13

Key Takeaways
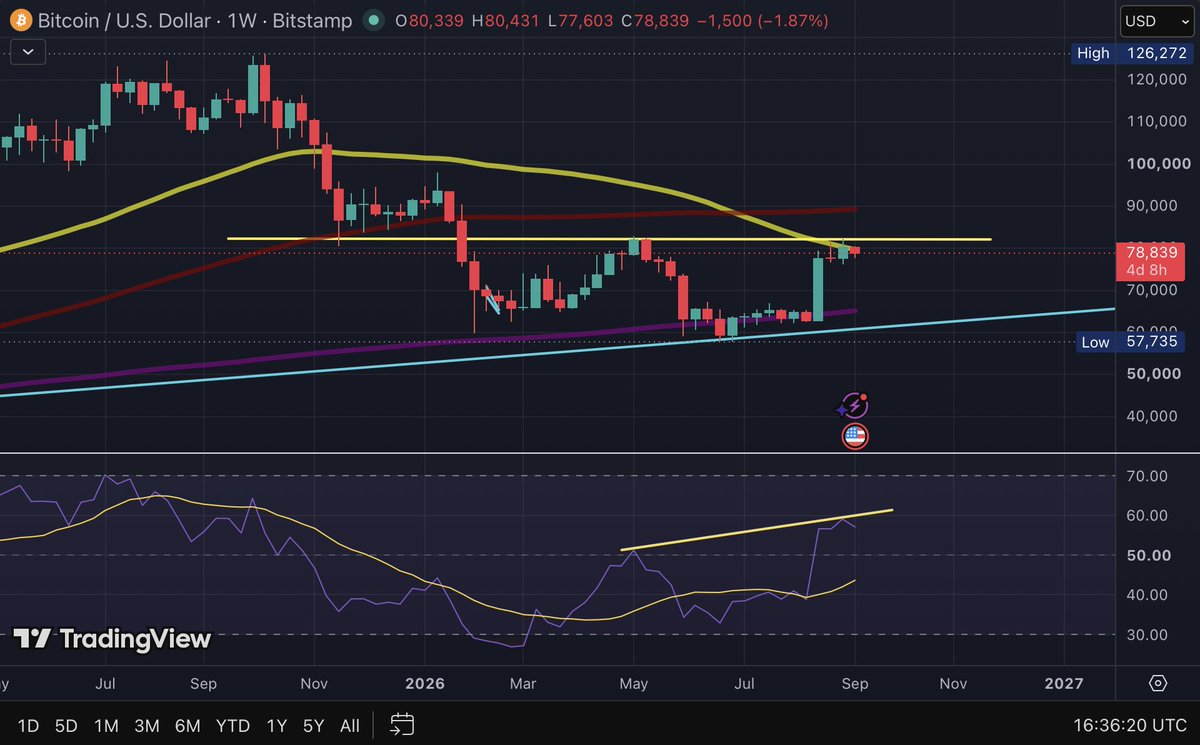
- The 50-week SMA sits near $79,600.
- $82,000-$82,800 forms the main breakout zone.
- RSI shows stronger relative momentum than May.
- Futures volume is roughly 15 times spot.
- ETF flows turned negative on September 8.
Bitcoin faces two separate weekly barriers
The first obstacle on the Bitstamp BTC/USD weekly chart is the falling 50-week simple moving average near $79,600. Bitcoin was approximately $1,100 below that level when the chart was captured, putting the average about 1.4% above the market price.





 English (US)