
Ethereum ($ETH) has officially broken below its highly watched $2,000 psychological support zone. As the broader digital asset ecosystem faces renewed selling pressure, the second-largest cryptocurrency by market capitalization is struggling to find stable ground.
While the drop past $2,000 represents a significant blow to short-term bullish momentum, historical chart structures suggest that a much stronger floor awaits lower on the horizon. Traders are now shifting their attention to the $1,800 level as the next key defensive zone for buyers.
Technical Breakdown: Analyzing the ETH/USD Weekly Chart
According to the weekly ETH/USD chart, Ethereum has entered a clear short-term bearish phase following a multi-week rejection from higher macro levels.
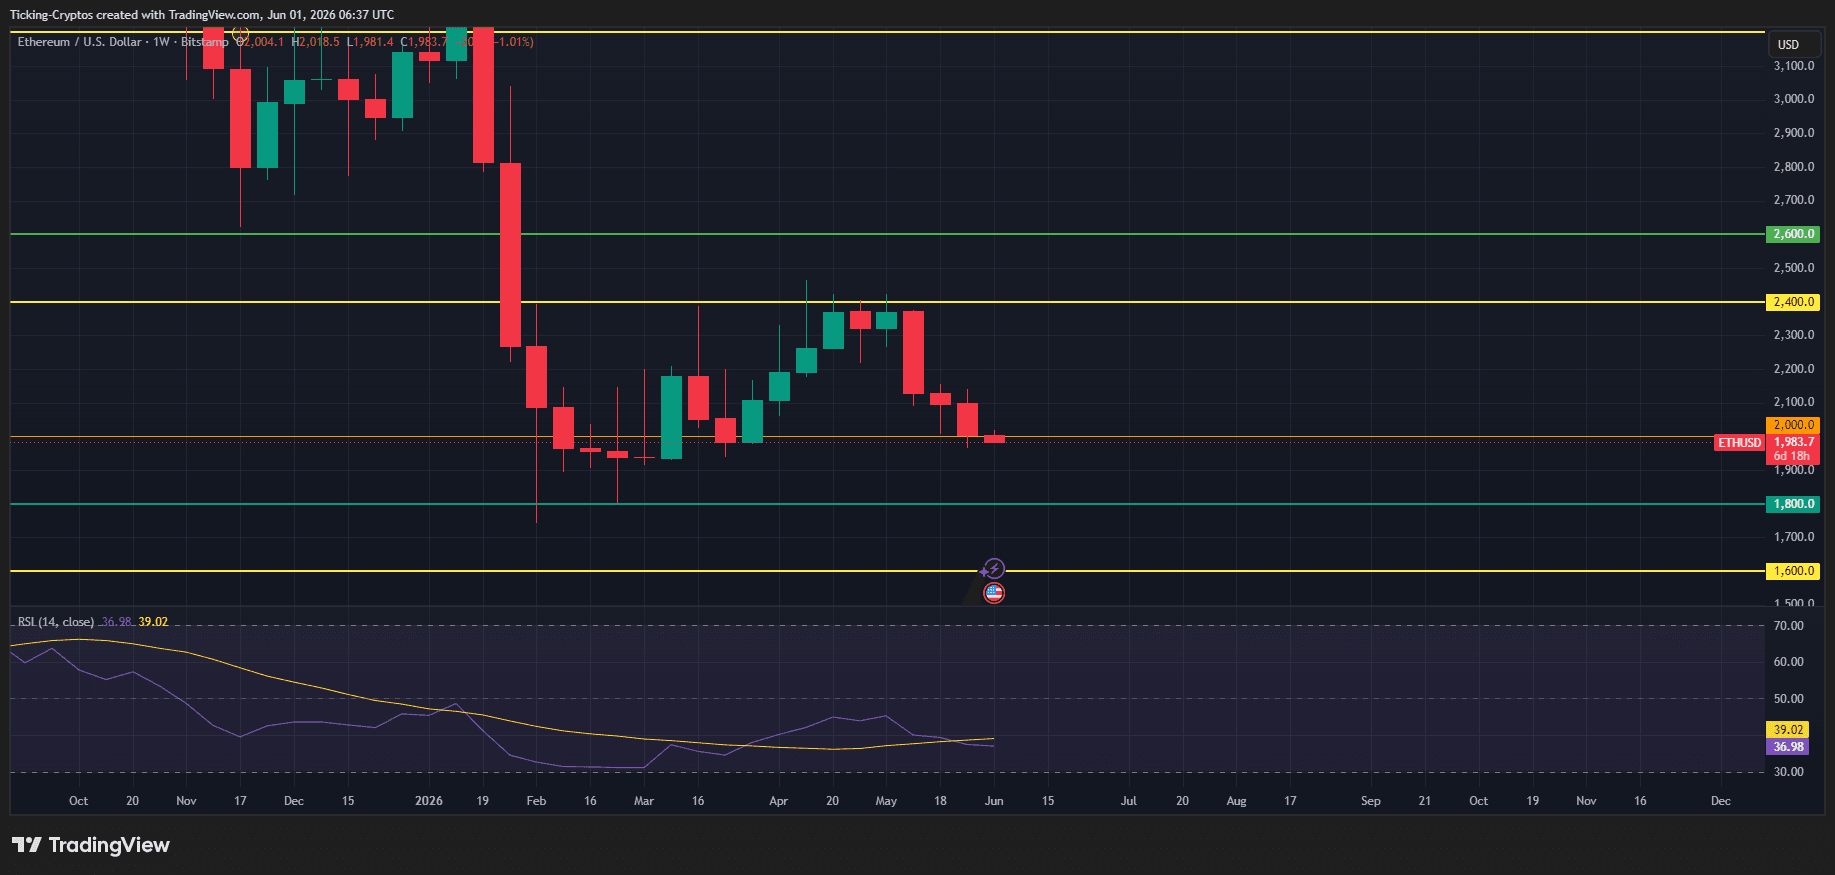
1. The Fall of the $2,000 Pivot Zone
The $2,000 price point is more than just a horizontal support line; it acts as an anchor for market sentiment. After spending the earlier part of the year consolidating above this region, the latest weekly candlestick shows clear bearish continuatio...


 English (US)