
 1 month ago
17
1 month ago
17

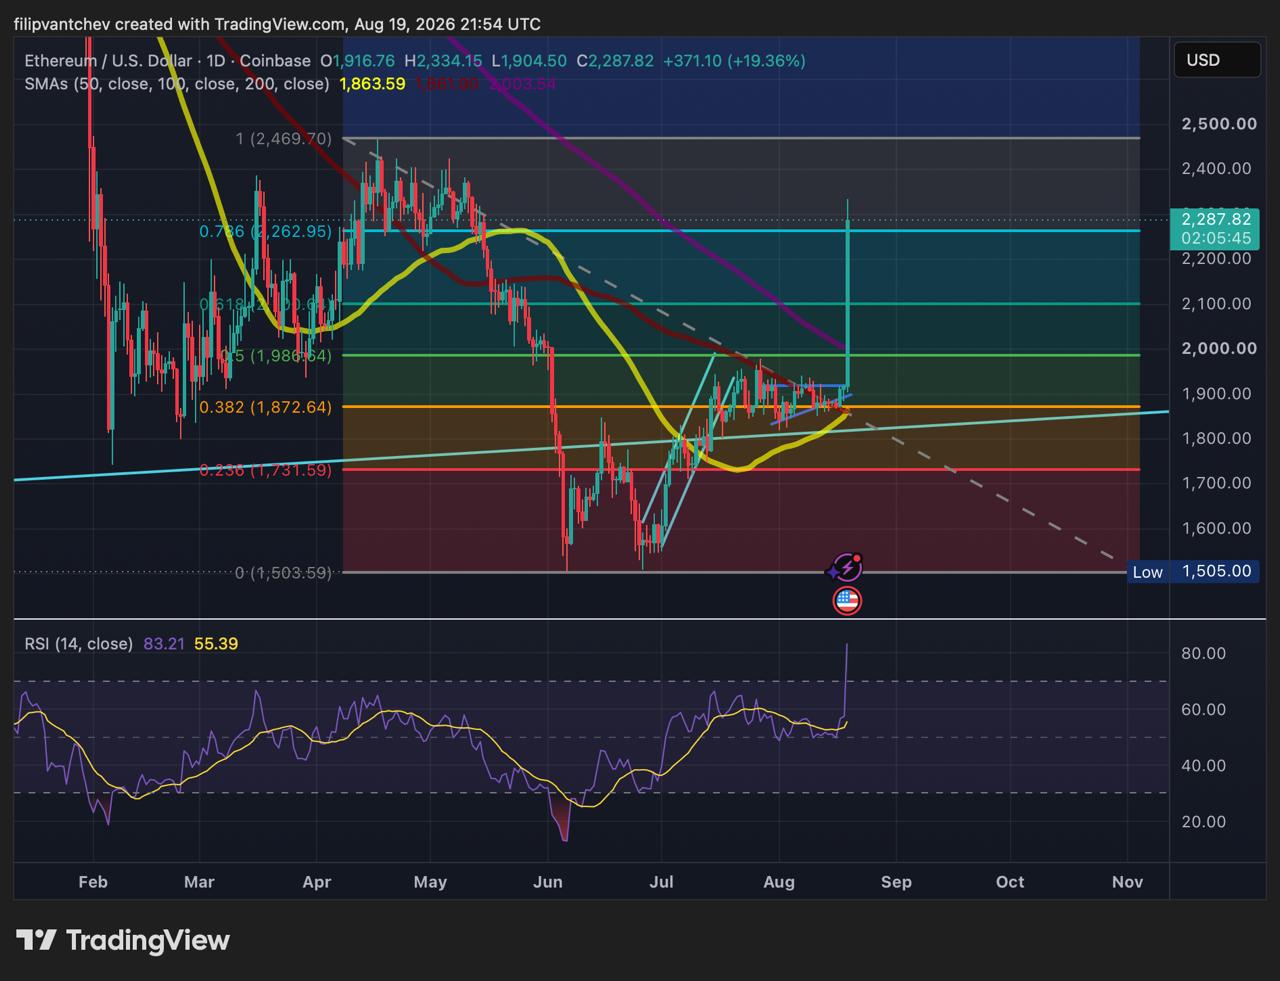
The move also changed the daily technical map: $2,100 has shifted from resistance to the first level buyers need to defend. The bigger test now sits on the weekly chart, where ETH is approaching resistance it has yet to clear.
The daily breakout put $2,100 below price
Before the rally, ETH had been trading between roughly $1,870 and $1,900. The daily 50-day and 100-day SMAs sat near $1,865, while the 200-day SMA stood at $2,000
 Read Entire Article





 English (US)