
 1 hour ago
1
1 hour ago
1

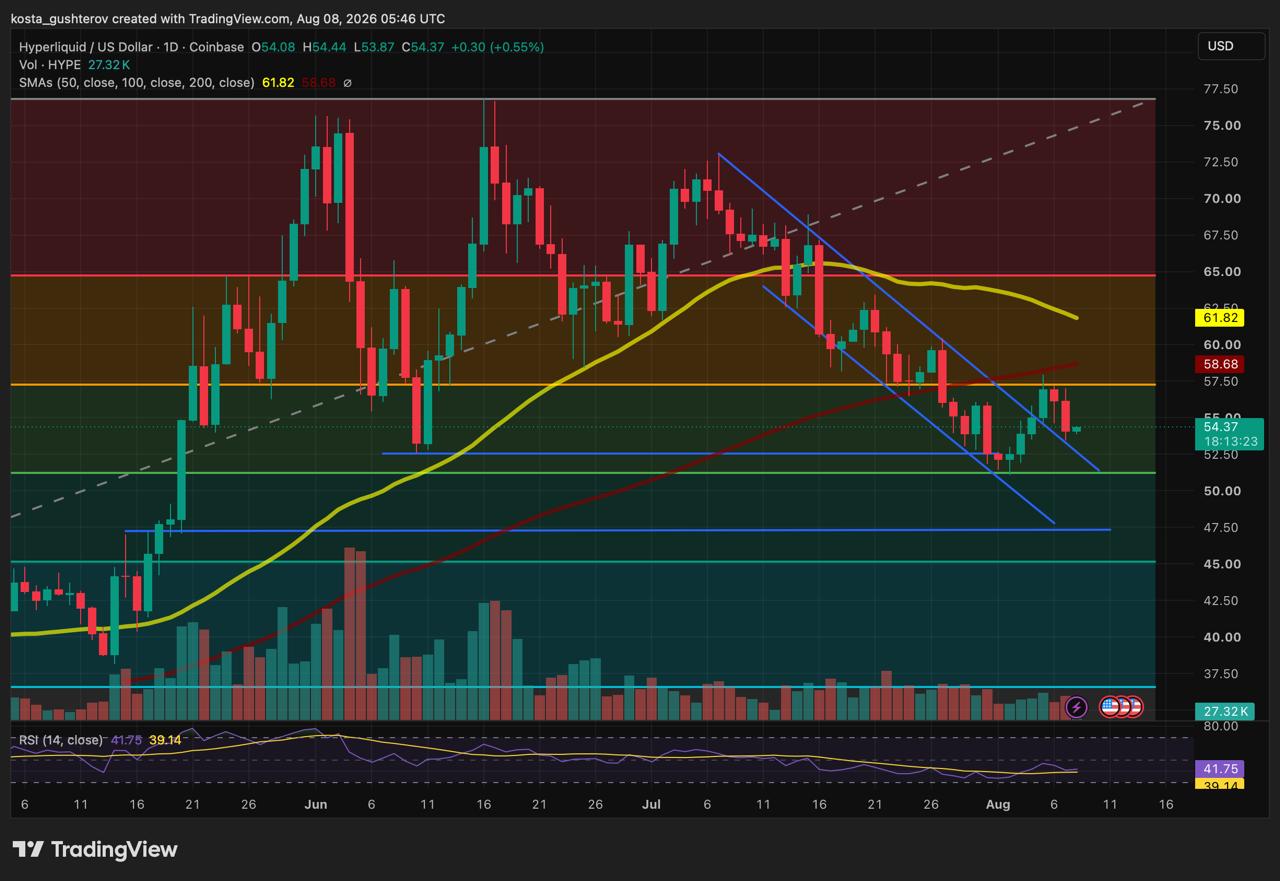
Price is now hovering near the upper boundary of its descending channel, while HYPE spot ETFs have posted their first positive week after three consecutive periods of outflows.
The pullback anticipated earlier this week has now materialised.
In our August 5 HYPE analysis, we highlighted resistance around $57–$58, where the rebound was approaching both a horizontal price barrier and the 100-day simple moving average. Failure to clear that area left the recovery vulnerable, with support near $52 sitting below.
 Read Entire Article





 English (US)