
 5 hours ago
6
5 hours ago
6

Key Takeaways
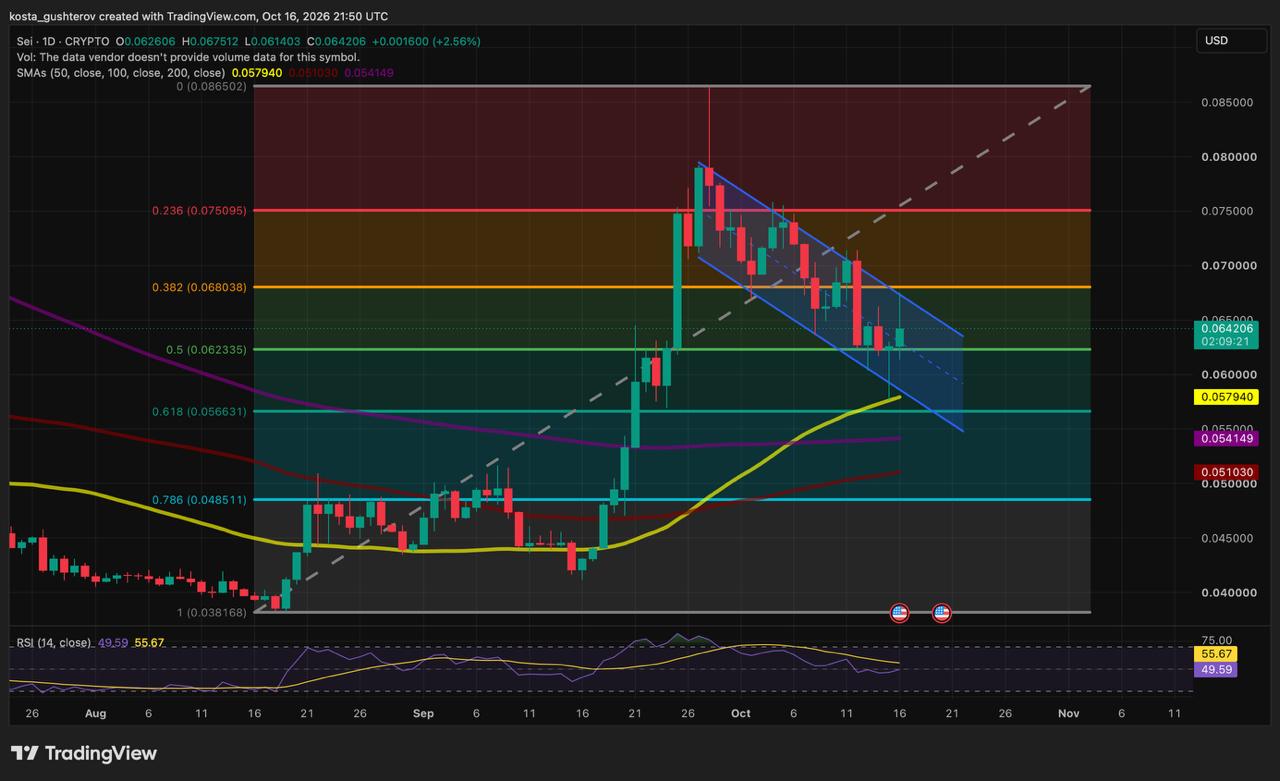
- SEI is trading around a repeatedly tested $0.0623 support area.
- The descending channel and $0.068 retracement are the nearest recovery hurdles.
- The rising 50-day average sits below price at $0.05794.
- RSI is near 50, showing that momentum has cooled substantially.
The SEI/USD daily chart on TradingView showed price at $0.0642 on October 16 at 21:50 UTC, up 2.56% on the open daily candle. SEI traded between $0.061403 and $0.0675 during the session before pulling back from its intraday high.




 English (US)