

For most of the past year, Solana was a chart nobody wanted to open. From roughly $240 last October it bled almost without pause into a June low near $62. Then in mid-August the whole thing changed in about three sessions, and $SOL has spent the last month doing something it had not done all year: holding above $100.
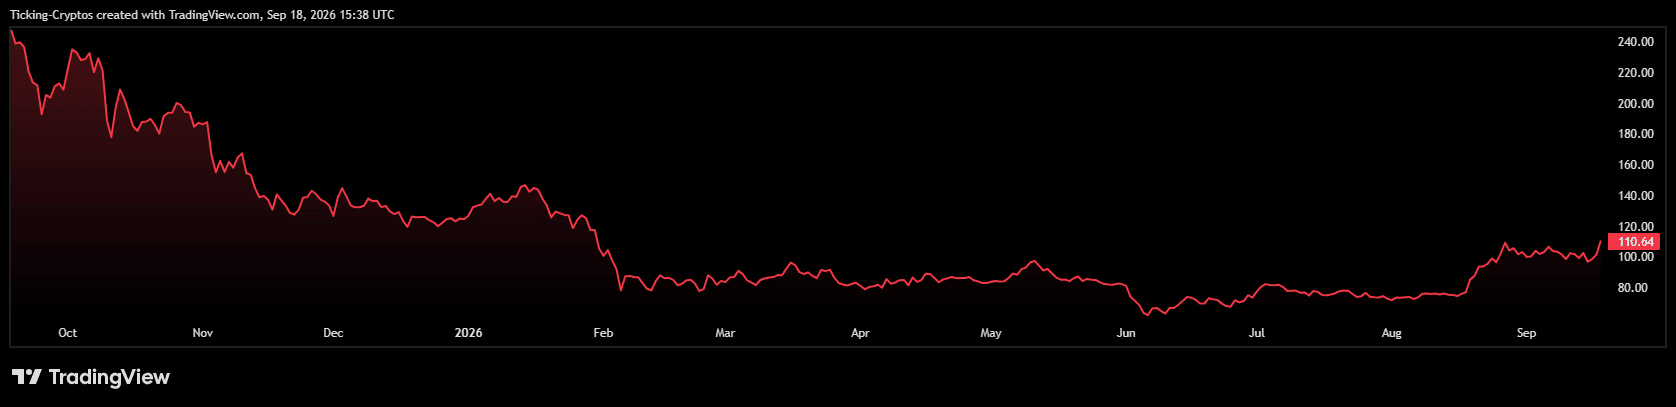 SOL chart in USD
Where is the SOL price right now?
$Solana has just tagged $110. That is the top of the range it has traded in since the August breakout, and it is the level this entire setup has been building toward. The session opened at $101.52 with a low of $100.80, so SOL has swung close to 10% inside a single day.
The floor is the other half of the story. $100 was the ceiling that capped every rally from February through August. It is now acting as the floor. A level that flips from resistance to support is the single most reliable signal in technical analysis, and SOL has now defended it repeatedly, includi...





 English (US)