
 1 hour ago
4
1 hour ago
4

XLM traded near $0.1836 on October 14 at 21:30 UTC, down 3.57% on its open daily candle. The XLM/USDT chart on Binance shows a session low near $0.1822, approximately level with the 200-day simple moving average. Price recovered only slightly from that low.
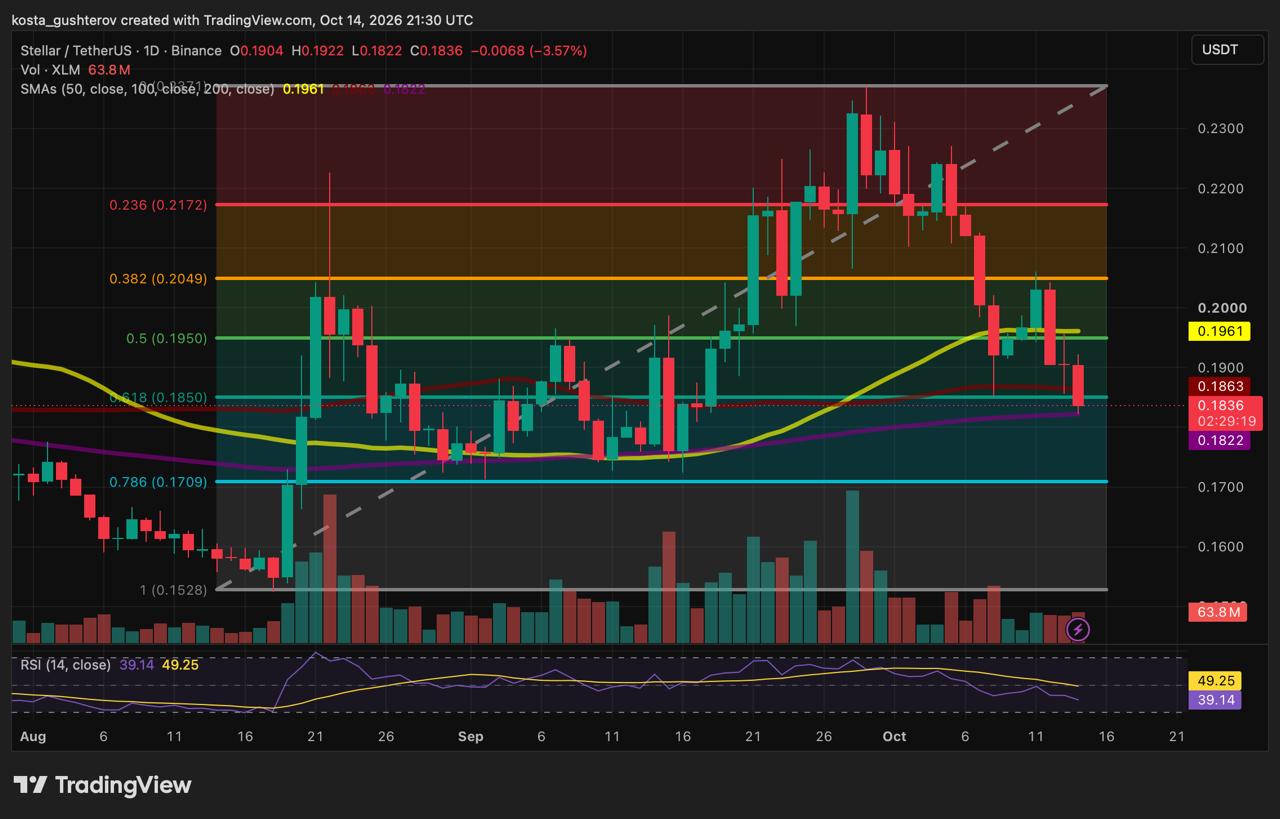 Stellar reaches its 200-day moving average / Source:





 English (US)