

The XRP price lost the $1.50 mark on Monday morning, trading around $1.47 after a 2.9% daily drop. That is not the end of the world, but it is an important level, and the way $XRP behaves around it will decide the whole week. Here is what the chart is telling us.
Why Did the XRP Price Drop Below $1.50?
Zoom in on the last seven days and the picture is clear: XRP has been printing lower highs since the local peak near $1.63 on September 23. A second attempt at $1.60 on September 25 failed as well, and since then the price has been bleeding slowly, from $1.55 to $1.52 to $1.50, and now $1.47.
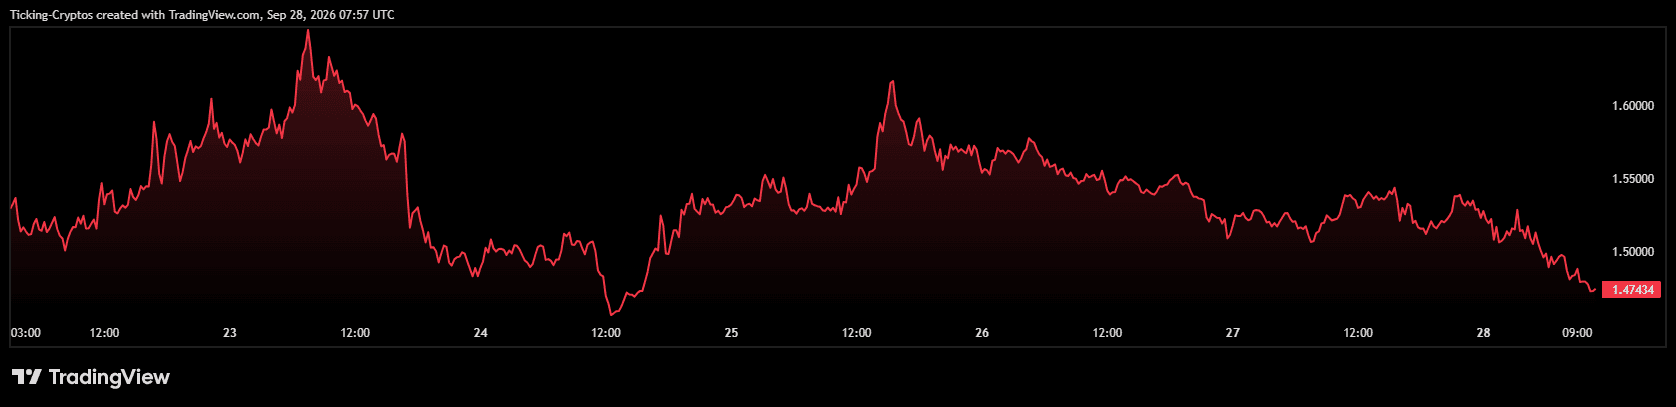 XRP chart in USD
Nothing dramatic happened on any single day. This is the kind of sell-off where buyers simply do not show up, and every small bounce gets sold. After the strong rally in early September, some cooling was overdue, and the market is now testing whether $1.50 is real support or just a number.
Check the live Read Entire Article





 English (US)