
 2 hours ago
4

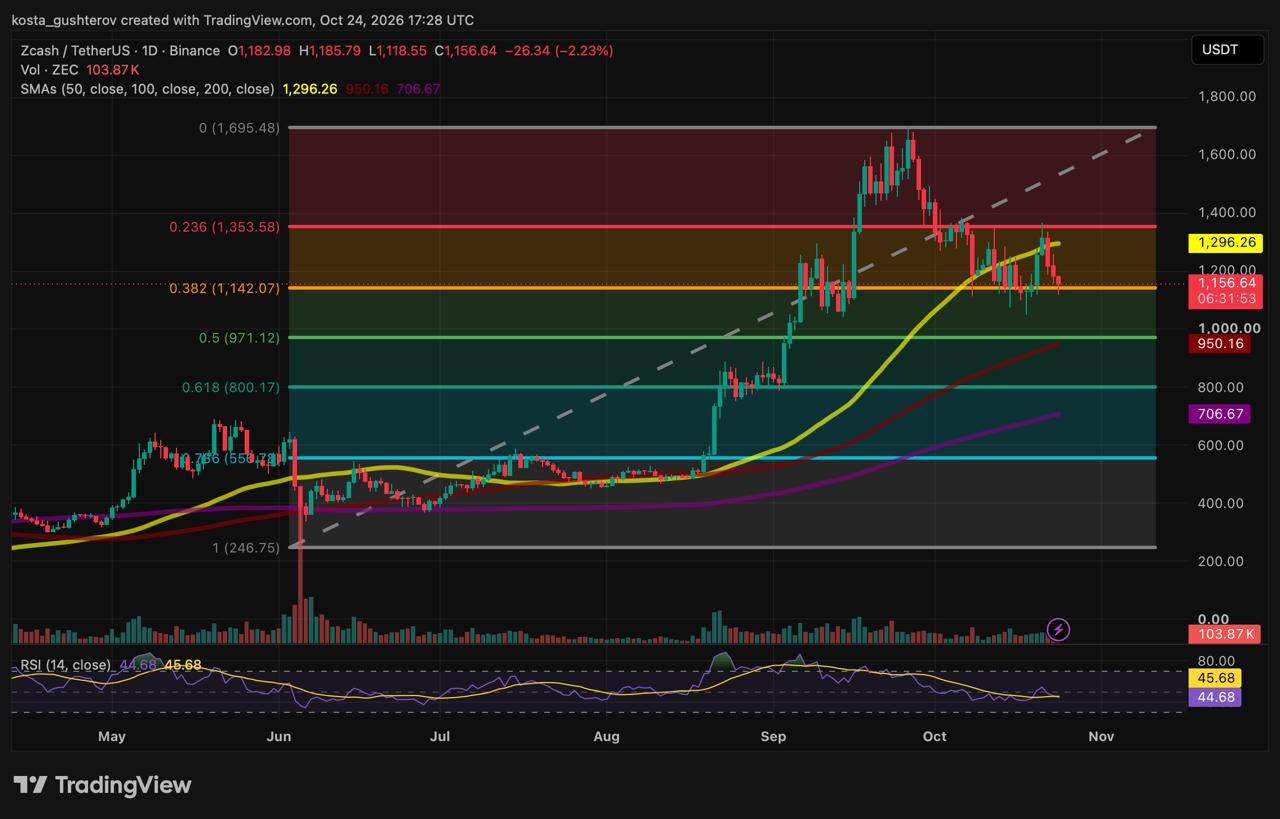
Binance’s ZEC/USDT daily chart on TradingView shows the token still trading more than 360% above its early-June low near $247, even after the latest pullback.
What happened at the 50-day SMA
Earlier this week, ZEC snapped back from the 0.382 Fib with the 50-day SMA as the obvious target. The average did its job as resistance: the rally’s candle left a ...





 English (US)