
 1 hour ago
4
1 hour ago
4

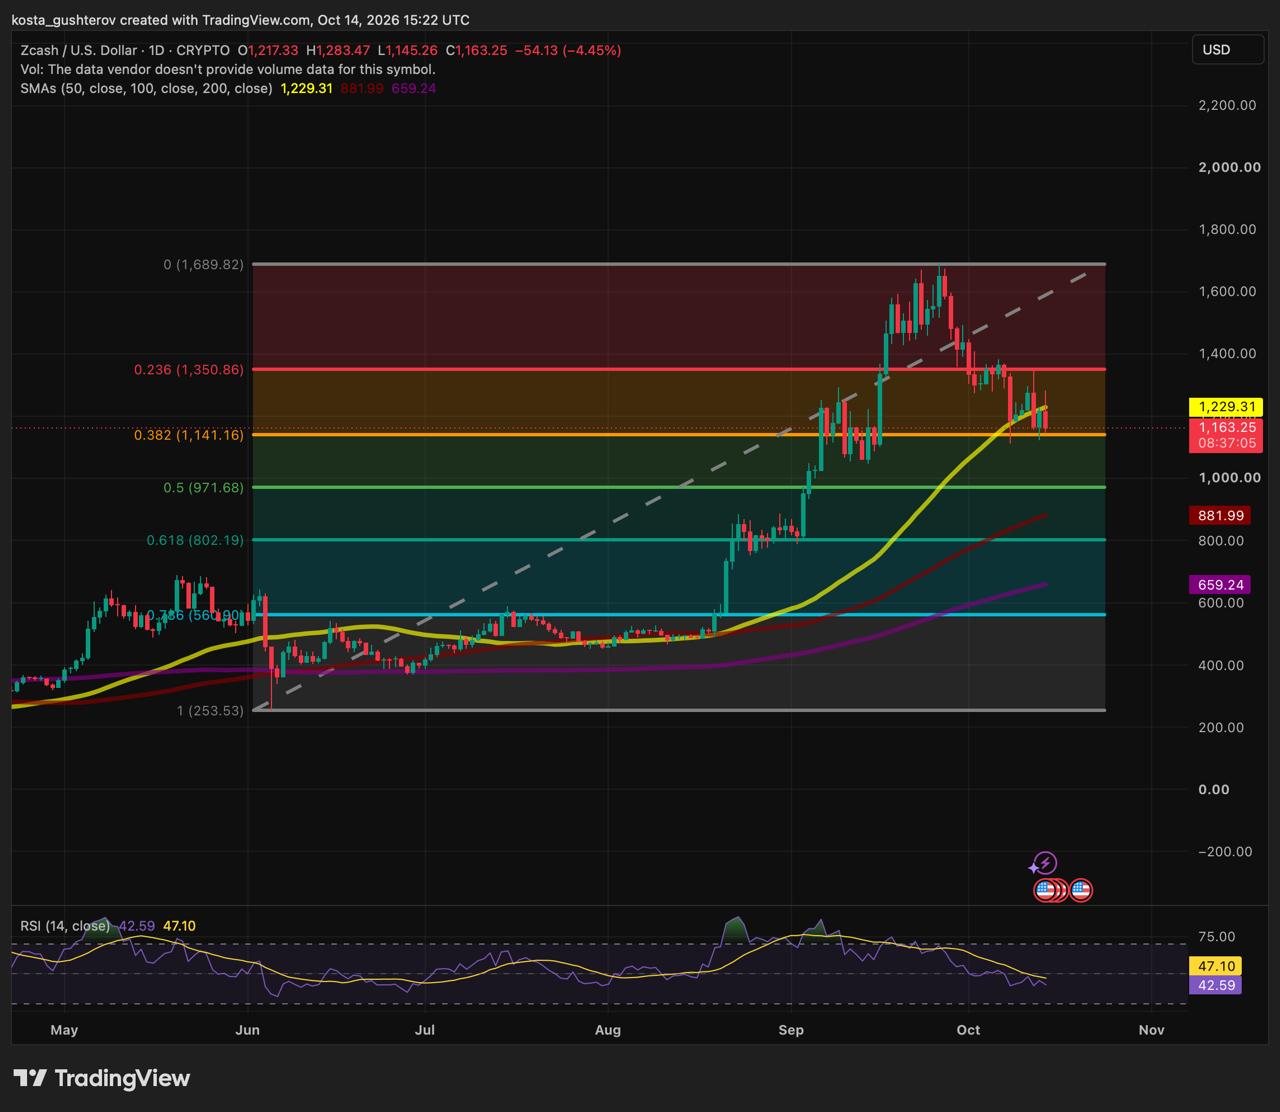
ZEC tests $1,140 after a 31% decline from its peak
ZEC traded near $1,163 on October 14 at 15:22 UTC, according to the ZEC/USD daily chart on TradingView. Its intraday low near $1,145 brought it close to the 38.2% Fibonacci retracement at $1,140.
 Zca...




 English (US)