
 6 hours ago
4

KEY TAKEAWAYS
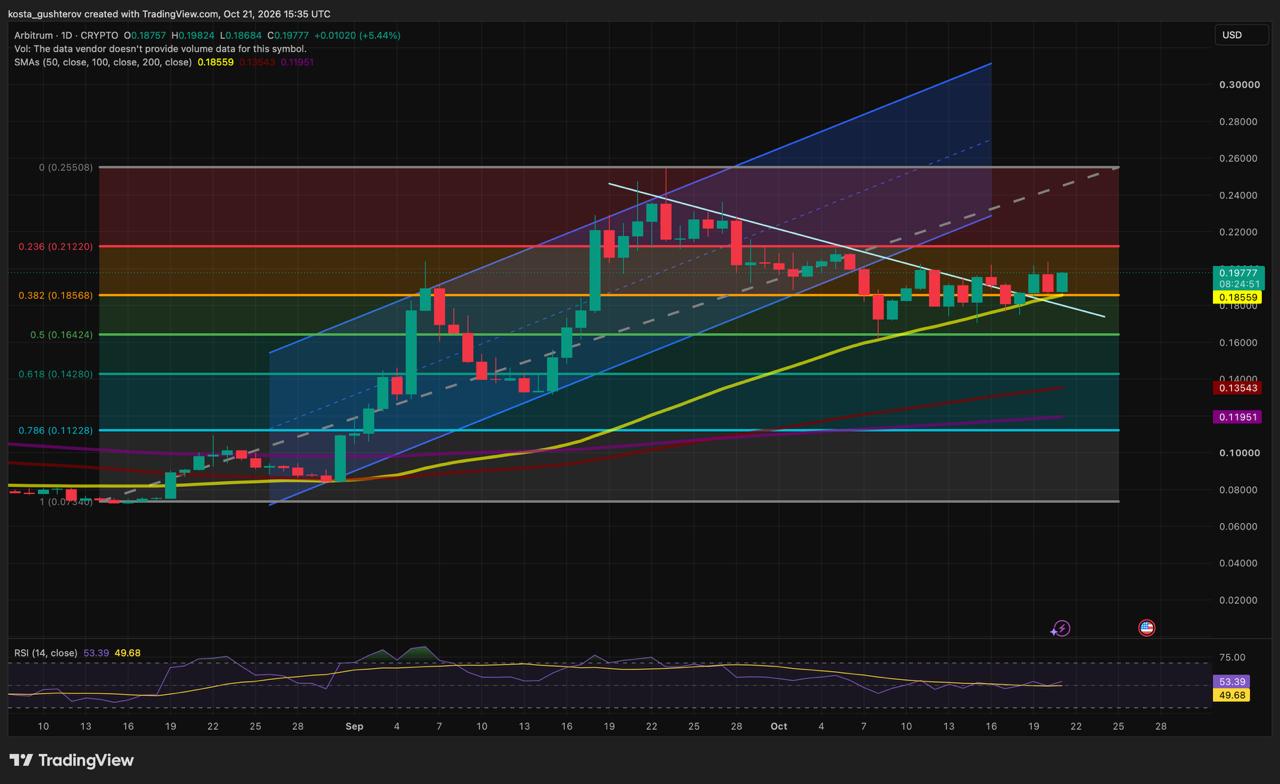
→ 50-day SMA and 0.382 Fib meet near $0.186.
→ Rallies keep stalling near $0.205 since mid-October.
→ RSI climbs back above its 50 midpoint.
→ ARB trades 22% below September’s $0.255 high.
On the ARB daily chart from TradingView, the rebound leaves the token about 169% above its mid-August low near $0.073.
From the September peak to an October base
ARB’s August rally added nearly 250% before topping out in late September. The slide that followed broke the rising channel the token had tracked since late August, and on October 8 a wick reached the 0.5 Fib near $0.164 before buyers stepped in.
 Read Entire Article





 English (US)