
 2 hours ago
2
2 hours ago
2

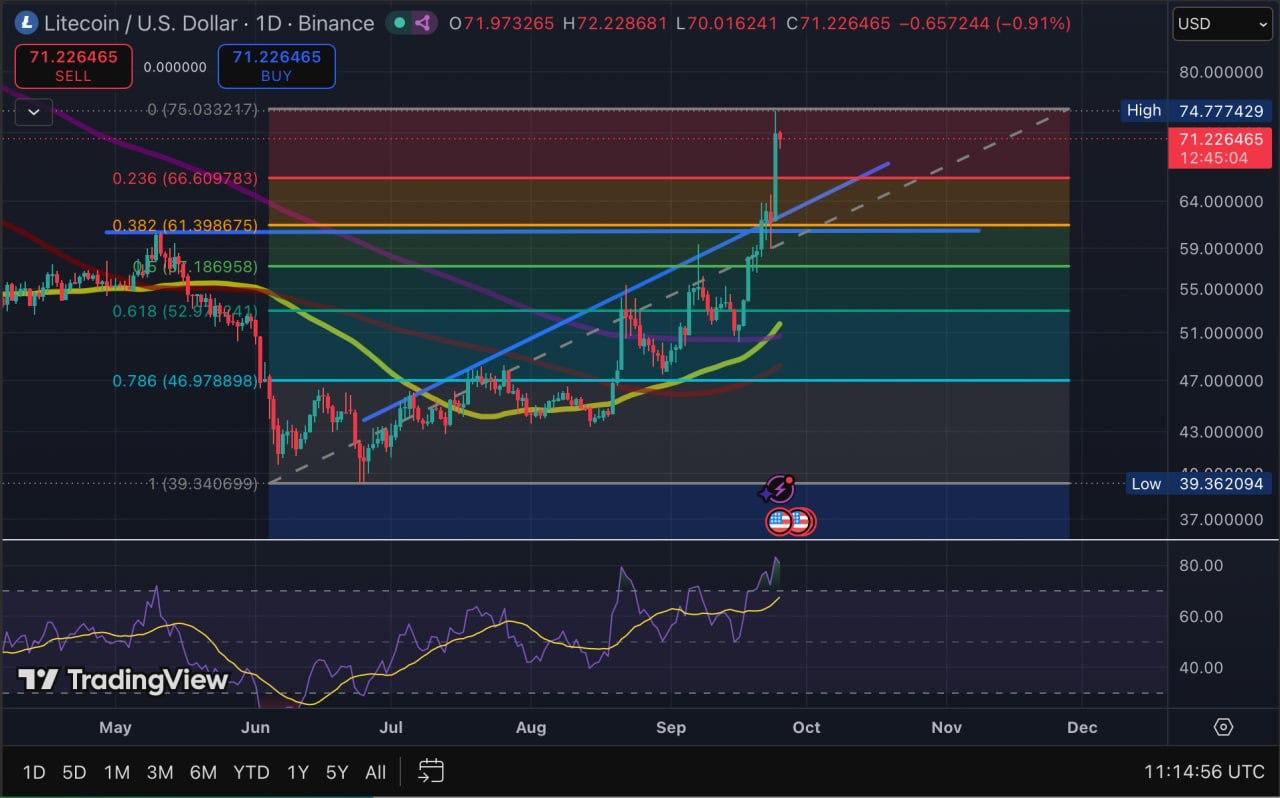
What Litecoin has changed on the daily chart
LTC has moved through two distinct forms of resistance. The first is the horizontal high reached in May. The second is the descending line that had limited rallies since July. Clearing both does not settle the longer-term trend, but it does give the daily chart a different structure from the one that governed the summer.
 Read Entire Article





 English (US)